The Quality Scorecard
Five dimensions, how issues pull scores down, and what makes a run Successful.
Every iteration ends with a Quality Scorecard: five scores, one per quality dimension, rolled up into a single Score from 0 to 100. The Score is what the check-in compares with your threshold, and what the Leaderboard averages across runs.
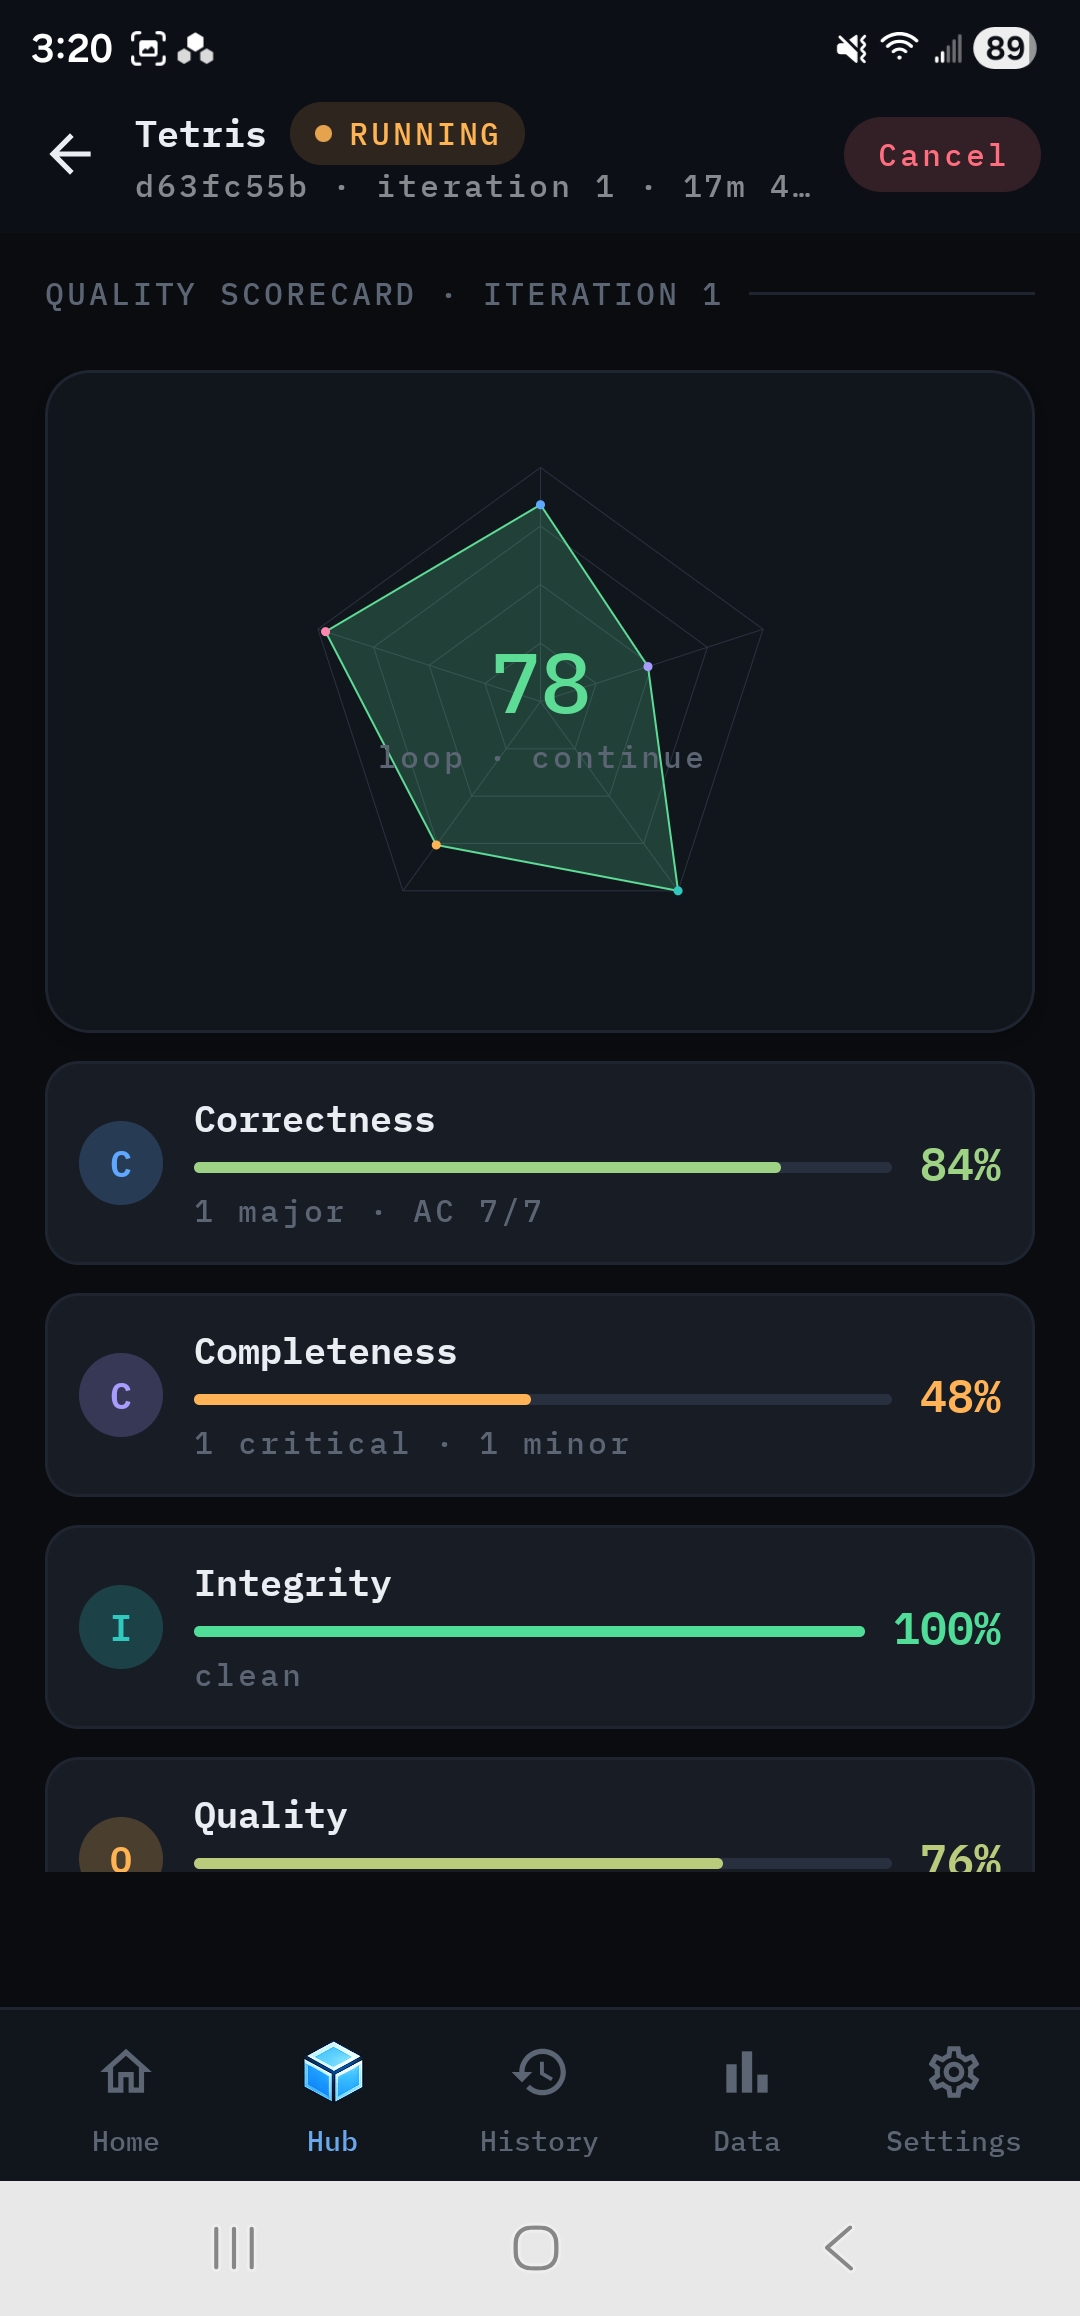
The five dimensions#
QA assigns every issue it finds to exactly one dimension, with a severity of critical, major or minor.
- What it measures
- Does the code do the right thing? Also includes the pass rate of the functional acceptance criteria.
- Examples of issues
- Wrong results, runtime errors, broken logic, security defects.
- What it measures
- Is everything the brief asked for there? Also includes the pass rate of the coverage acceptance criteria.
- Examples of issues
- Missing features, stubs, files the plan called for that were never delivered.
- What it measures
- Do the files fit together?
- Examples of issues
- An HTML id the JavaScript expects that doesn't exist; a CSS class that matches nothing; a broken import. Cross-file breaks are always critical.
- What it measures
- Is the code well built?
- Examples of issues
- God functions, deep nesting, copy-pasted blocks, missing error handling, naming and formatting nits.
- What it measures
- Can everyone use it?
- Examples of issues
- Missing alt text or labels, buttons that are really
<div>s, low contrast, no keyboard access, confusing focus order.
How issues pull a score down#
Each dimension starts at 100% and is multiplied down by its open issues. The rate depends on severity, expressed as a half-life: the number of issues it takes to halve the score.
- Half-life
- 1
- Effect
- Each critical issue halves the dimension.
- Half-life
- 4
- Effect
- Four majors halve it.
- Half-life
- 20
- Effect
- Twenty minors halve it.
For Correctness and Completeness, the result is also multiplied by the share of their acceptance criteria that pass. Passing 9 of 10 caps the dimension at 90%.
For Integrity, Quality and Accessibility, finding nothing wrong only counts if something was actually built. If an iteration produced no files, those three score zero.
Scores never hit a floor or a ceiling artificially. A catastrophic build separates clearly from a merely weak one.
The Score#
The Score is the weighted geometric mean of the five dimensions, shown as 0 to 100. By default all five weigh the same.
A geometric mean punishes a single collapsed dimension much harder than an average would. An app that is perfect in four dimensions but scores 0 in Integrity has a Score of 0. Weak spots can't be averaged away.
You can change a dimension's weight from 0 to 5 in quarter steps under New Run → Configuration → Scorecard. A higher weight gives that dimension more pull. At 0 it's ignored.
Successful#
A finished run is labelled Successful only when both of these are true:
- the final Score is at or above your Score threshold (default 85), and
- there are zero open critical issues in any dimension.
A run that reaches the threshold with a critical issue still open finishes as Run finished · not Successful · N critical.
The threshold is also what Autorun aims for. It doesn't stop a run by itself; see Iterations and check-ins.
Per-dimension pass or fail#
Each dimension row also shows a plain-language pass or fail, for example Passing: zero criticals, AC 5/5. These are the gate rules:
- No criticals, and at least 95% of functional acceptance criteria pass
- At least 90% of coverage acceptance criteria pass, and no planned file is missing
- Something was built, and there are no criticals
- Something was built, no criticals, and at most 2 majors
- Something was built, no criticals, and at most 3 majors
The gates help you see why a score is where it is. They don't decide when the loop stops.
Trends across iterations#
From the second iteration on, each dimension shows whether it is improving, stable or regressing compared with the previous iteration. A move of 5 points or more counts as a change. The scorecard timeline also marks where your notes landed, so you can see what a note did to the score.