Compare models and track spend
Use the Leaderboard and Token Usage reports to find what works for you.
Every run records its score, time and spend, down to every individual model call. The Data tab turns that into two reports: the Leaderboard, for which models and providers build best, and Token Usage, for where your money goes. All of it is computed on your phone from your own runs.
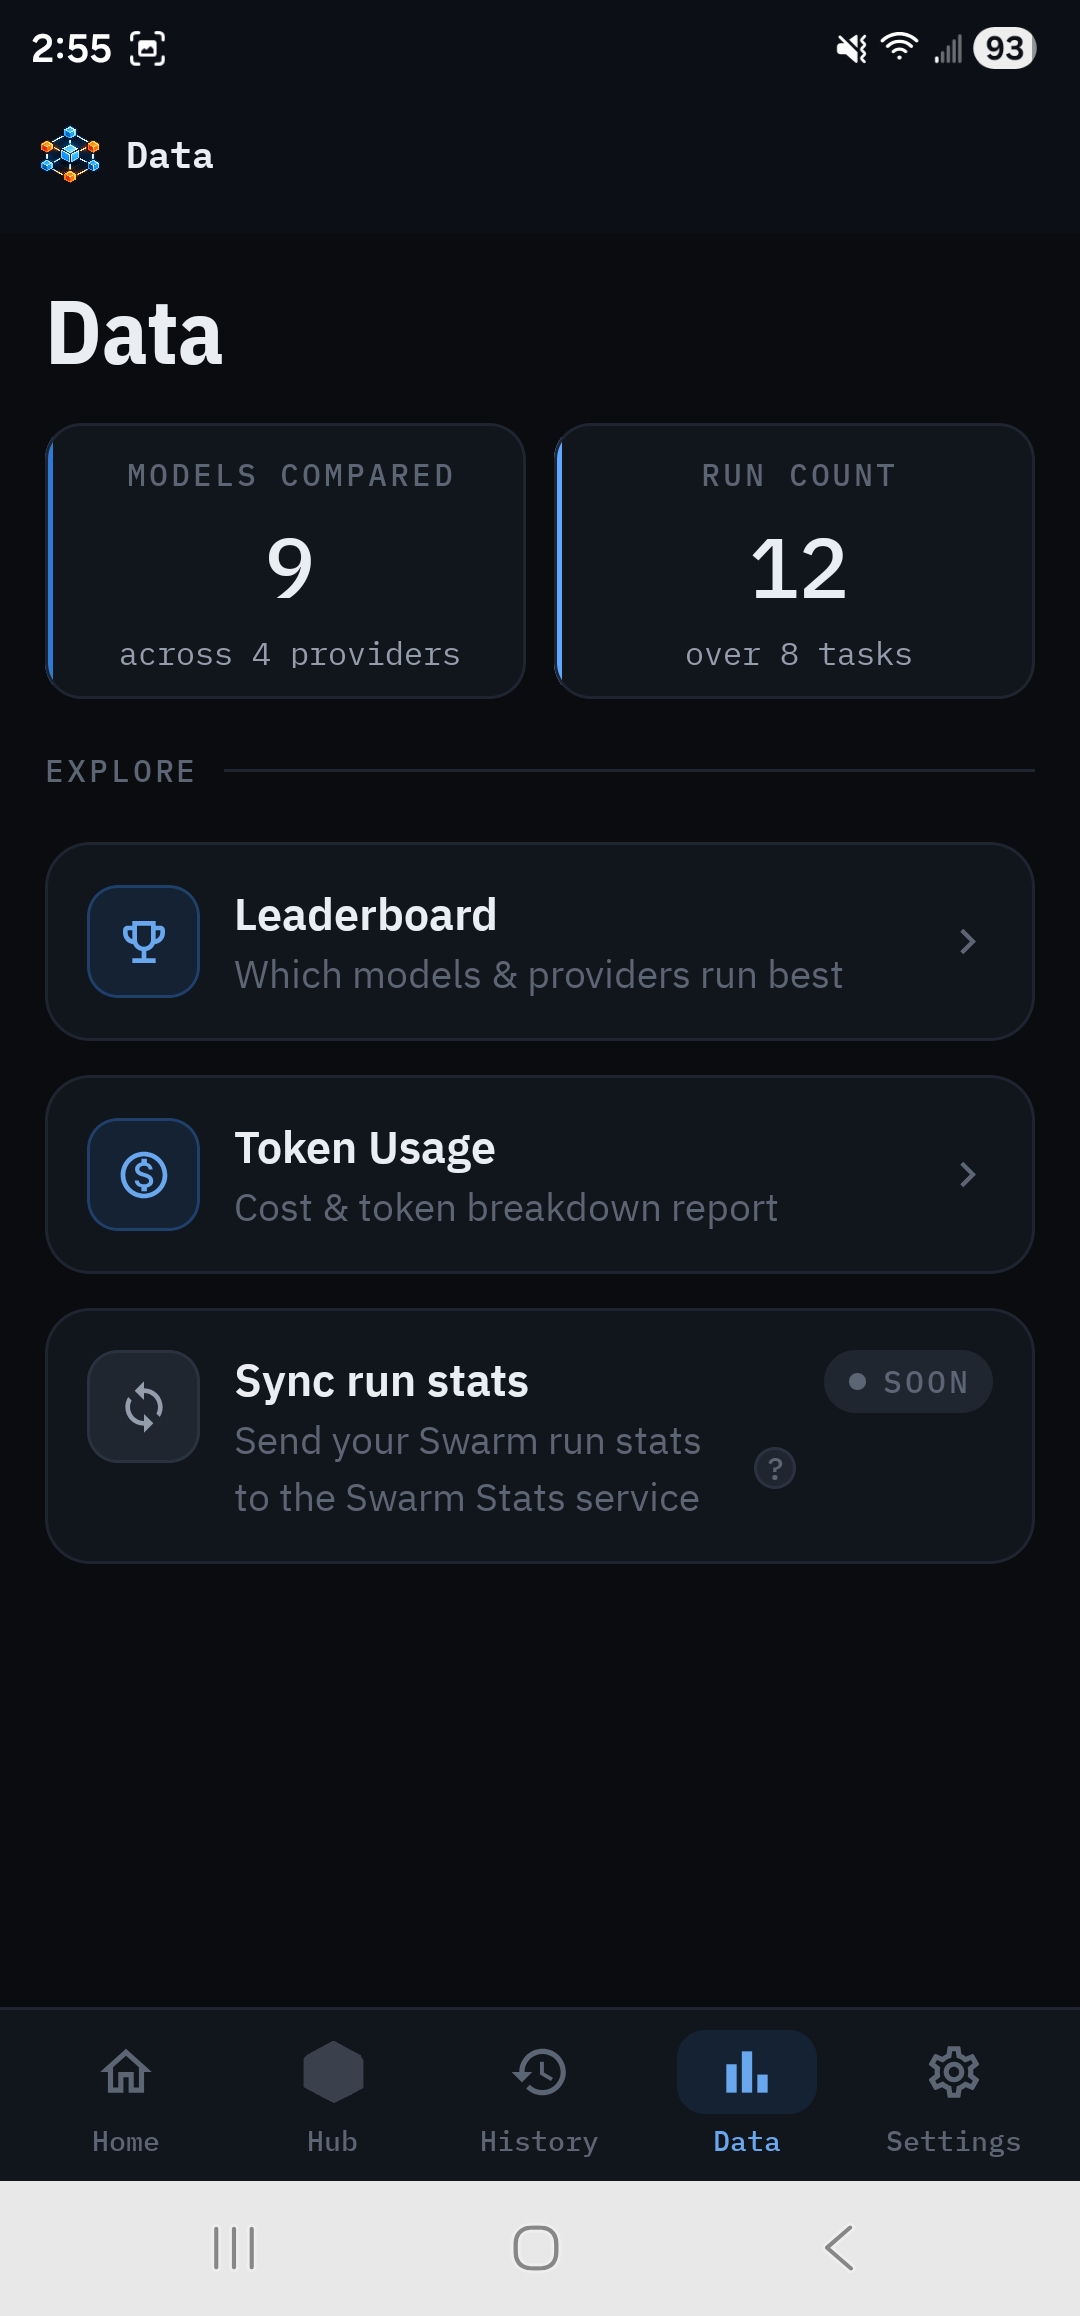
The top of the Data tab shows how many models you've compared and your run count.
Leaderboard#
Data → Leaderboard ranks your runs grouped the way you choose.
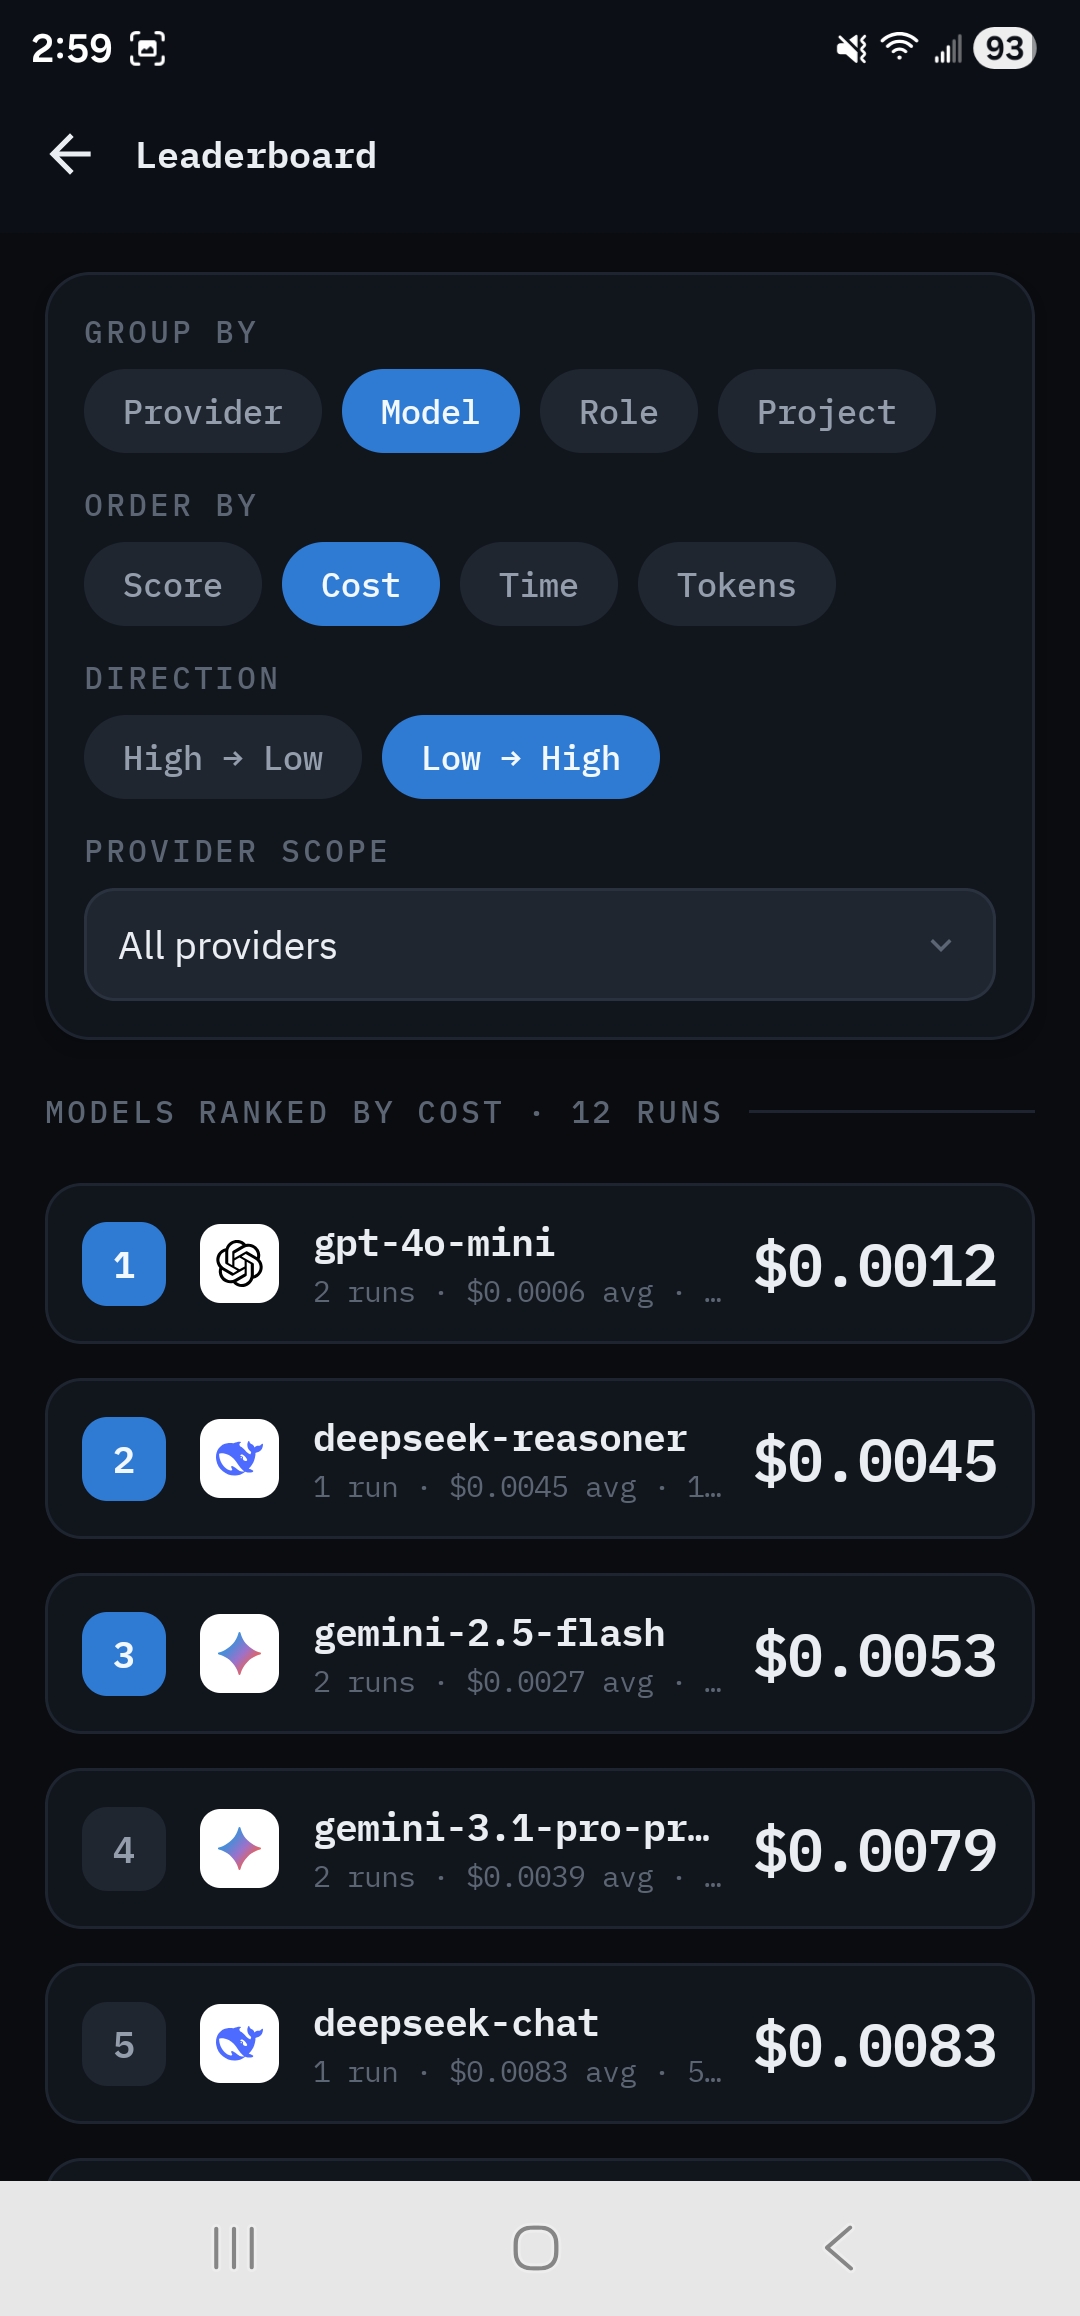
- Group by: Provider, Model, Role or Project (the requirements doc a run built).
- Order by: Score (the mean Quality Scorecard result), Cost, Time, Tokens, Cache (hit rate) or Saved (dollars saved by caching).
- Direction: high to low, or low to high.
- Provider scope: all providers, or just one.
Each row shows its run count, average cost, average time and cache share. Tap a row for its detail: Mean score, Total cost, Total time and Tokens, plus Token efficiency:
- Share of prompt tokens served from the provider's cache.
- Dollars the cache saved compared with paying full price.
- What prompt tokens really cost after caching.
- How much of the output was hidden reasoning.
- Average and 95th-percentile wait before the model starts answering.
- How chatty this model or role is.
- Calls that had to be retried because of rate limits, overloads or dropped connections.
- Calls cut off at the max output tokens. If this is high, raise that role's budget.
Run a fair comparison#
To compare models on quality, keep everything except the model the same:
- Pick one bundled starter project. They're designed as benchmarks, with checkable acceptance criteria.
- On the Configuration tab, choose model A and tap Apply provider + model to all roles.
- Keep the threshold, QA mode, team size and iteration limit the same for every run. Run it.
- Repeat for model B, C, and so on.
- Open Leaderboard, set Group by Model, and order by Score, then by Cost.
Scores vary from run to run, so a few runs per model tell you more than one. The Leaderboard averages them.
Token Usage#
Data → Token Usage is a spend report across all your runs.
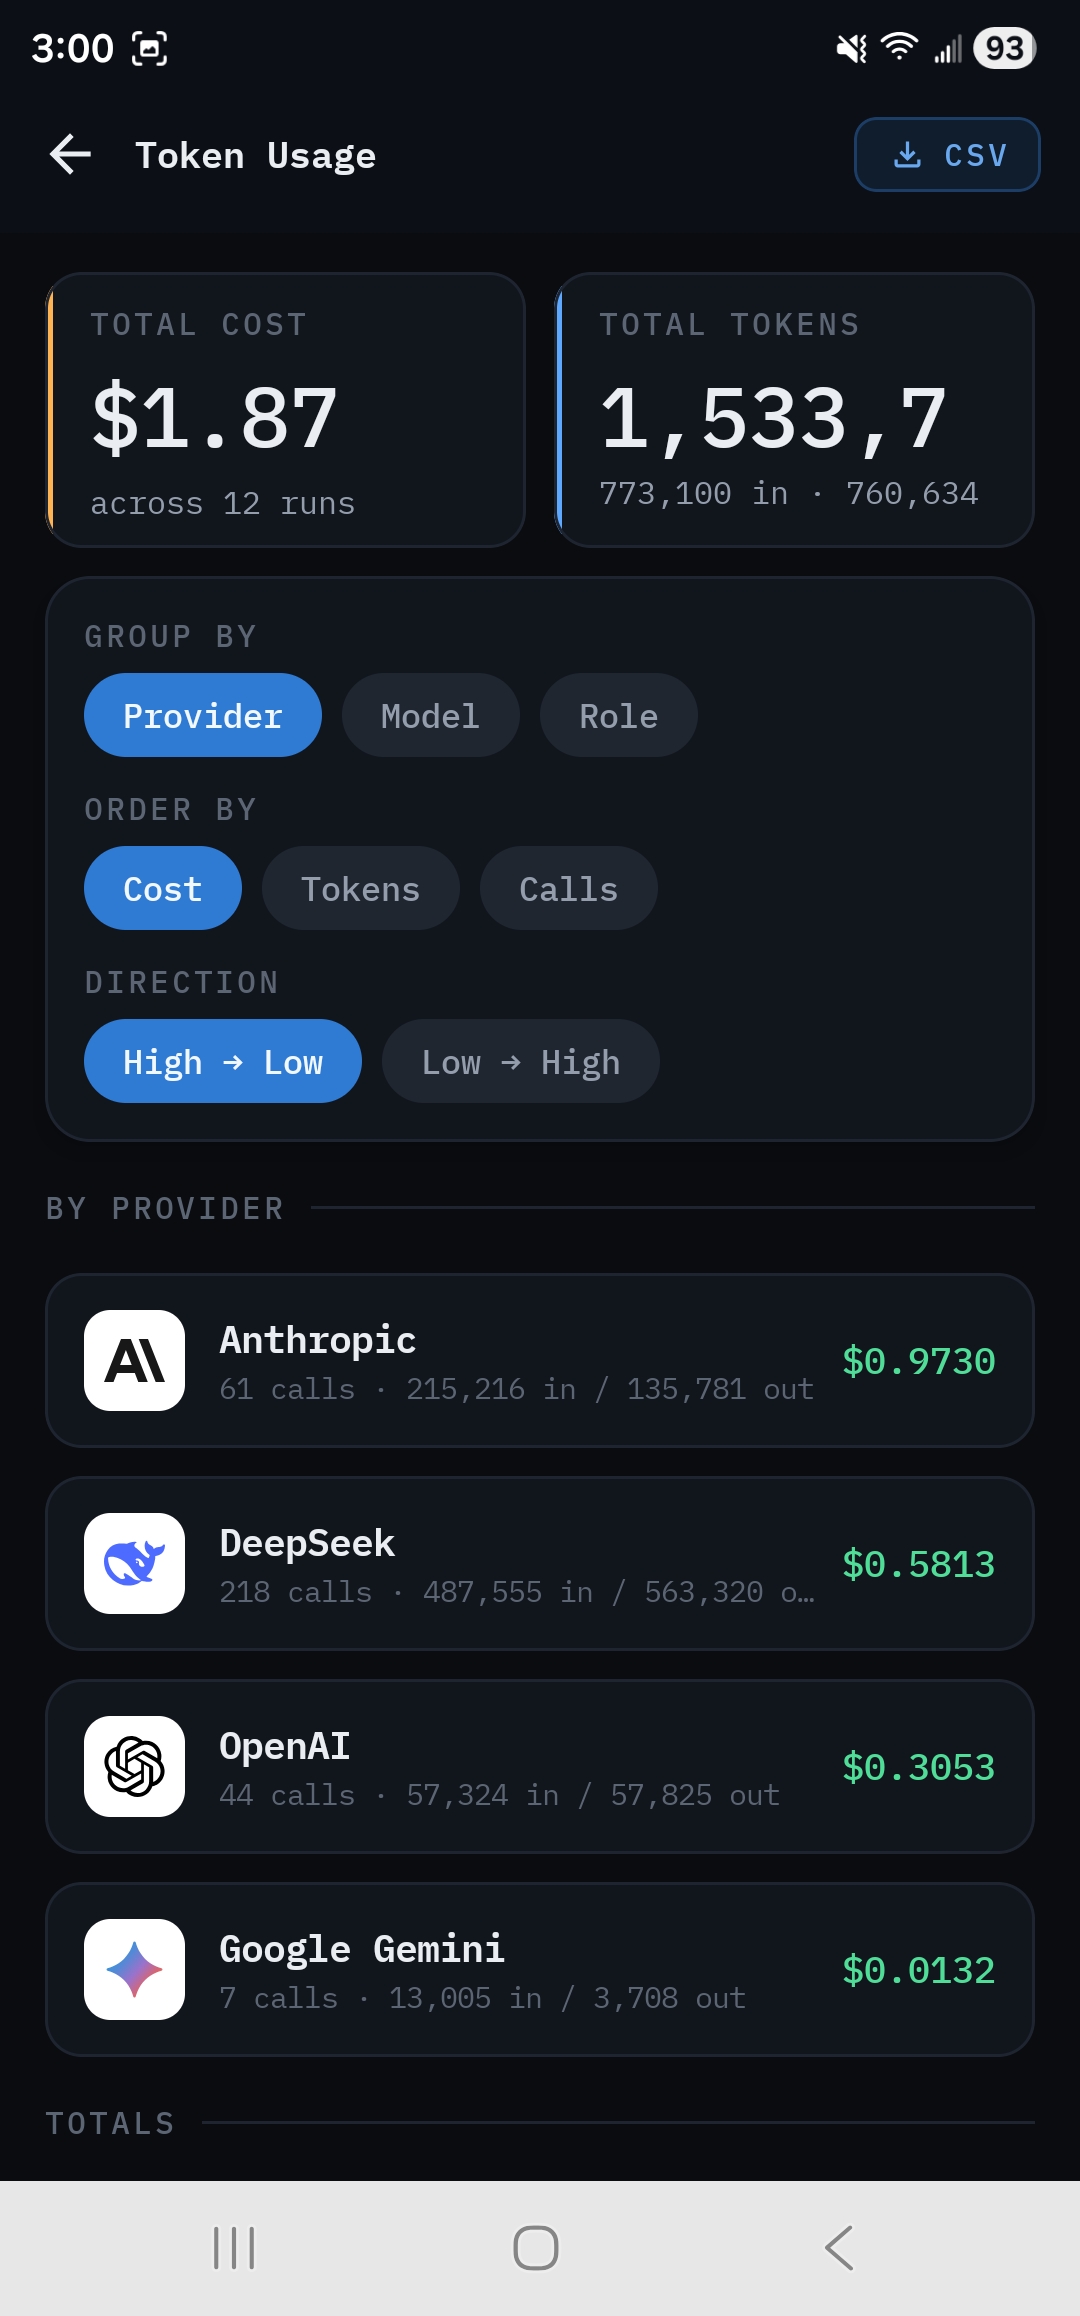
- The header totals Total cost and Total tokens (in and out).
- Group by Provider, Model or Role; Order by Cost, Tokens or Calls.
- Totals lists API calls, tool calls, input and output tokens, cache reads, cache hit rate and total cost.
- Tap any row to drill down to its individual calls, with the run, phase and role of each one.
- CSV in the header exports the whole ledger to share or open in a spreadsheet.
Anonymous run stats (coming soon)#
Sync run stats, marked Soon, will let you contribute anonymous scores, cost, timing and token counts to Rdn Labs' Swarm Stats service. It will be optional, and it will never include your requirements, code, or anything that identifies you.